Kaplan/ Norton underline that the BSC is adaptive for private and profit-orientated as well as for public and non-profit organisations.

The Balanced Scorecard (BSC) is fundamentally a measurement and management structure which was developed and technologically advanced by Robert S. Kaplan and David P. Norton in the early 1990es.
Its development was the solution to the growing criticism on the one-dimensionality of other performance measurement systems, the effort of which was restricted to financial and past statistics.
For living up to the insisting and forthcoming requirements of the information era and to the changing competitive environments, pure finance- orientated control mechanisms are inadequate.
These days’ businesses need controlling systems which contain and consider companies’ strategic approaches and objectives and which are capable to measure recent and future business units’ value and contribution to organizations’ performance.
For that reason the BSC complements financial measures of past performance with non-financial measures of future performance.
The purpose is to discover a balance between short term and long-term targets, between financial and non-financial measures, between early and late indicators and internal and external performance perspectives.
The new viewpoints to be measured are from the perspective of Kaplan/Norton the customer, the internal-business-process and the learning-and-growth perspective, whereby intangible assets as knowledge, Innovation or customer satisfaction are becoming more focused on corporations’ Strategy.
These four outlooks provide the structure for the BSC. The authors highlight that the choice and the number of the additional drivers is adjustable and be determined by firms’ vision and strategy along with their industrial branch and profit orientation.
So Kaplan/ Norton also underline that the BSC is adaptive for private and profit-orientated as well as for public and non-profit organisations.
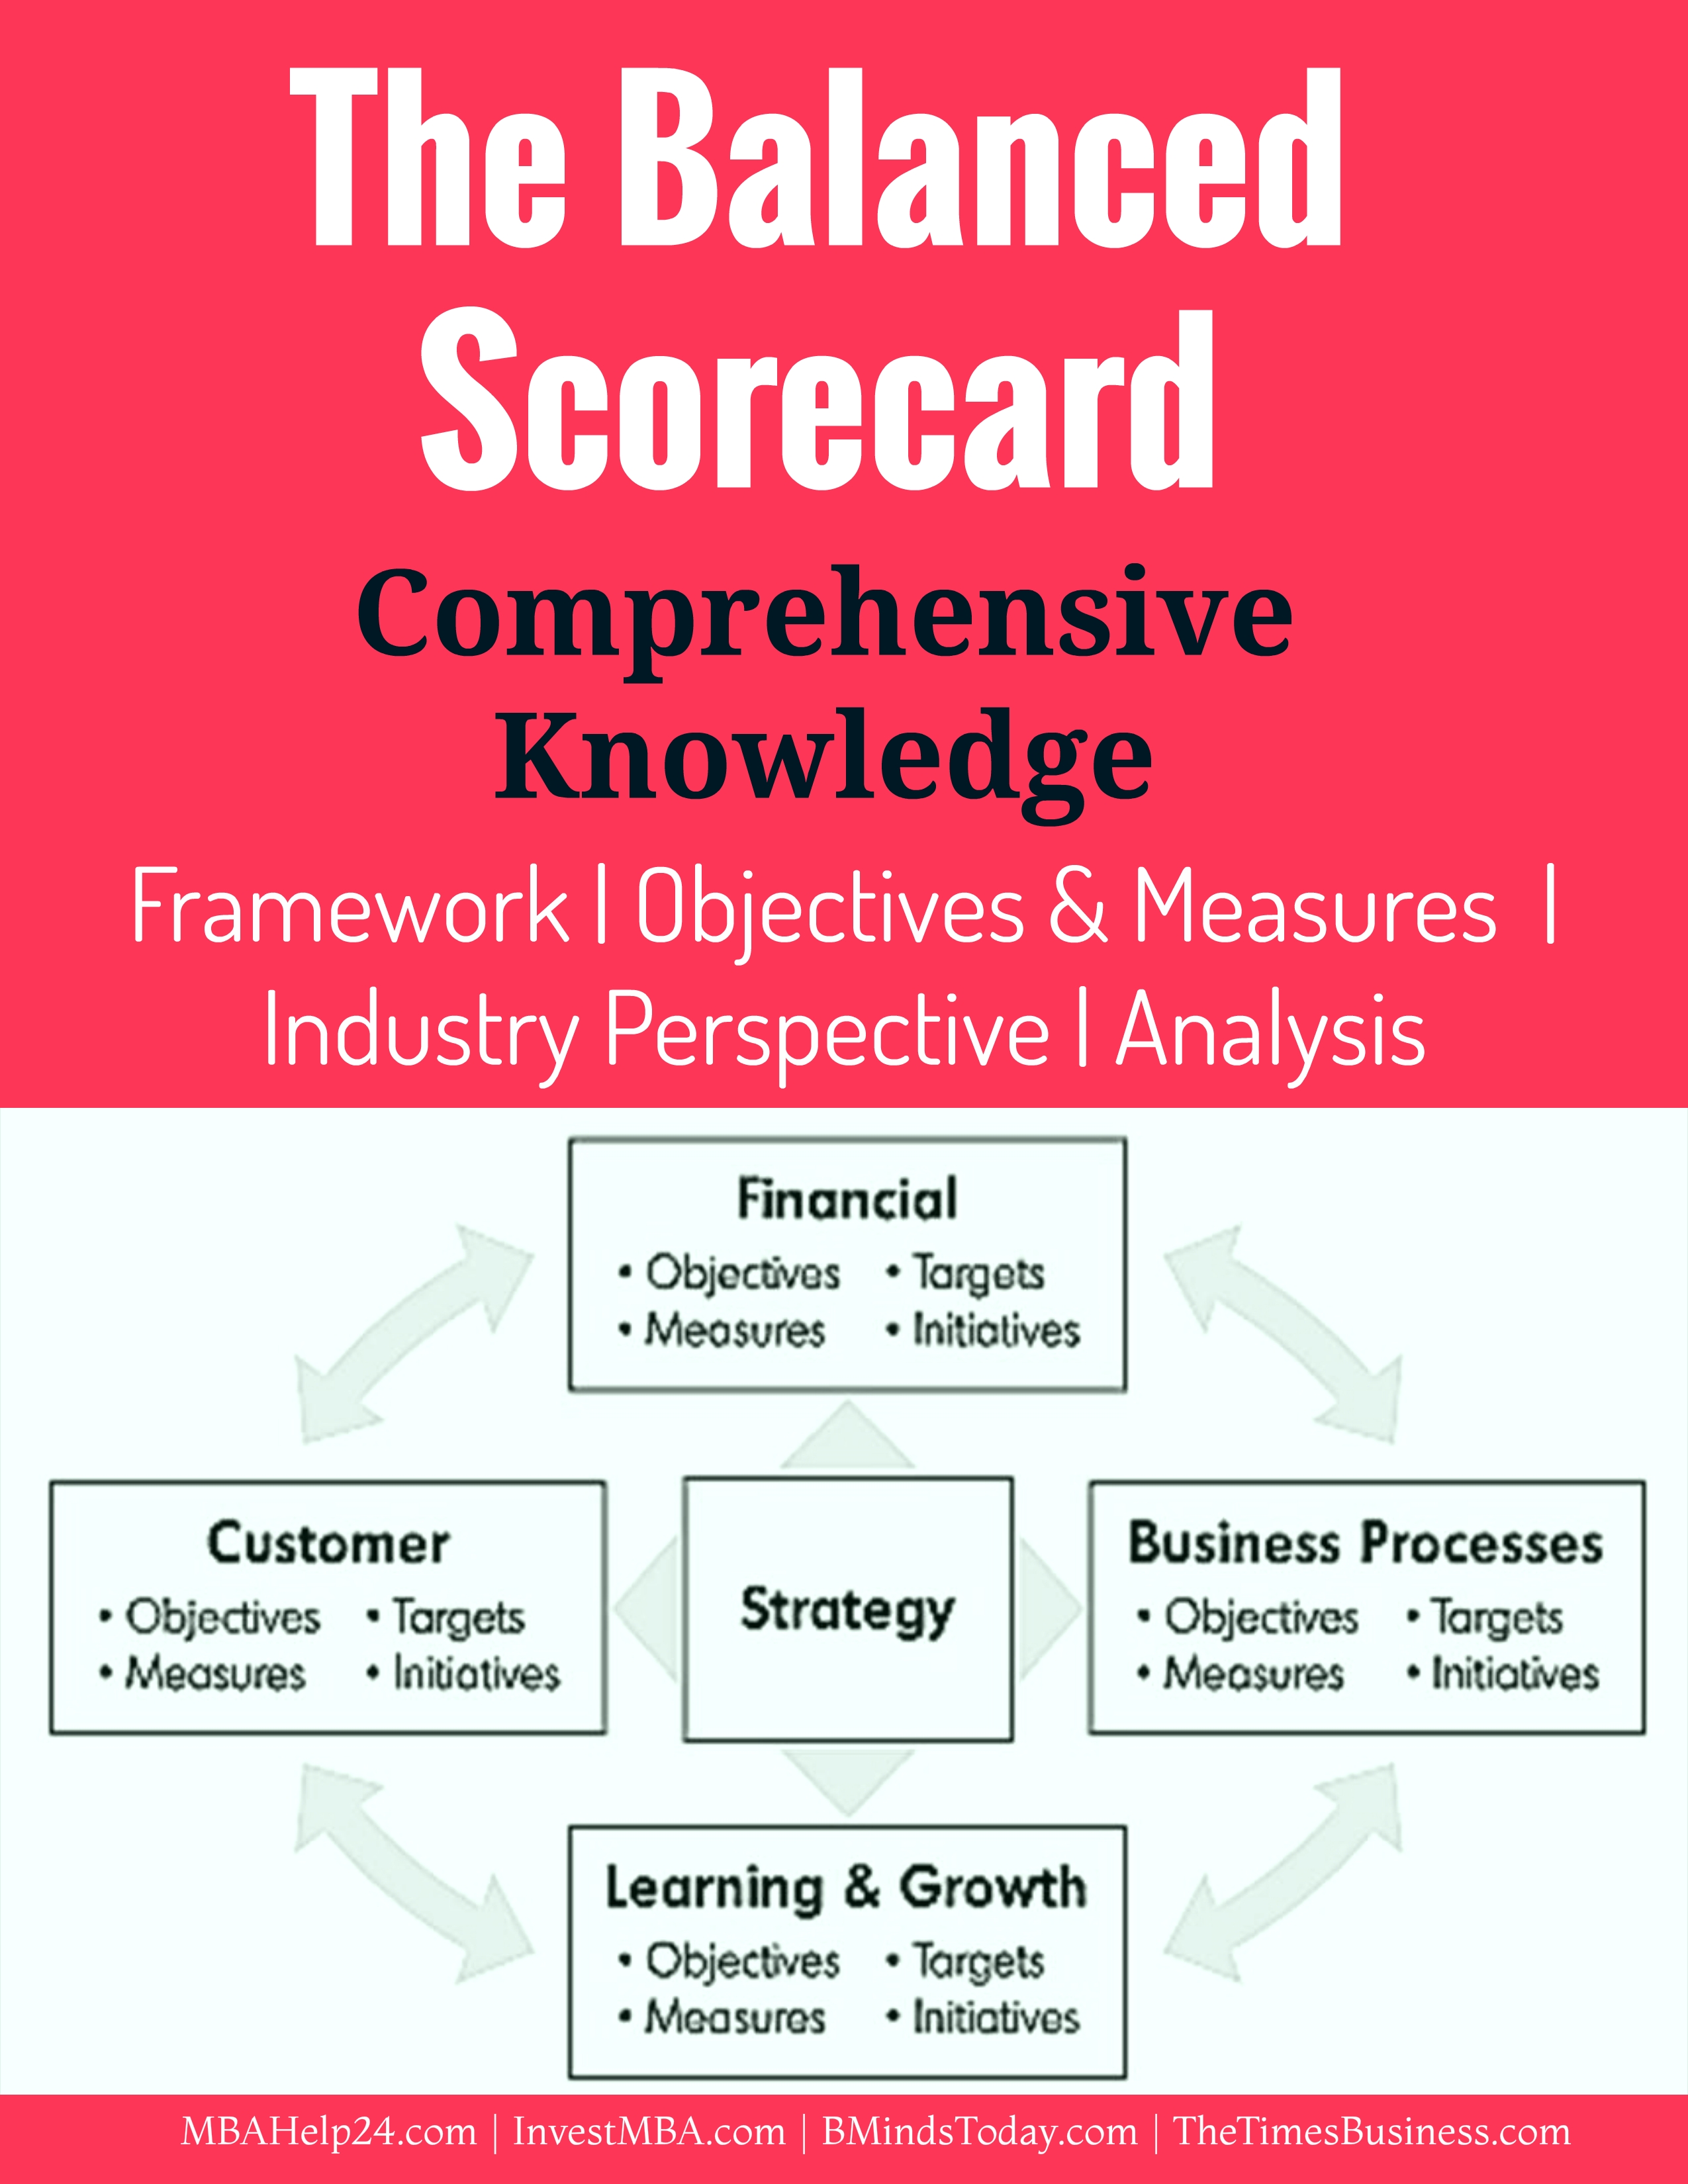
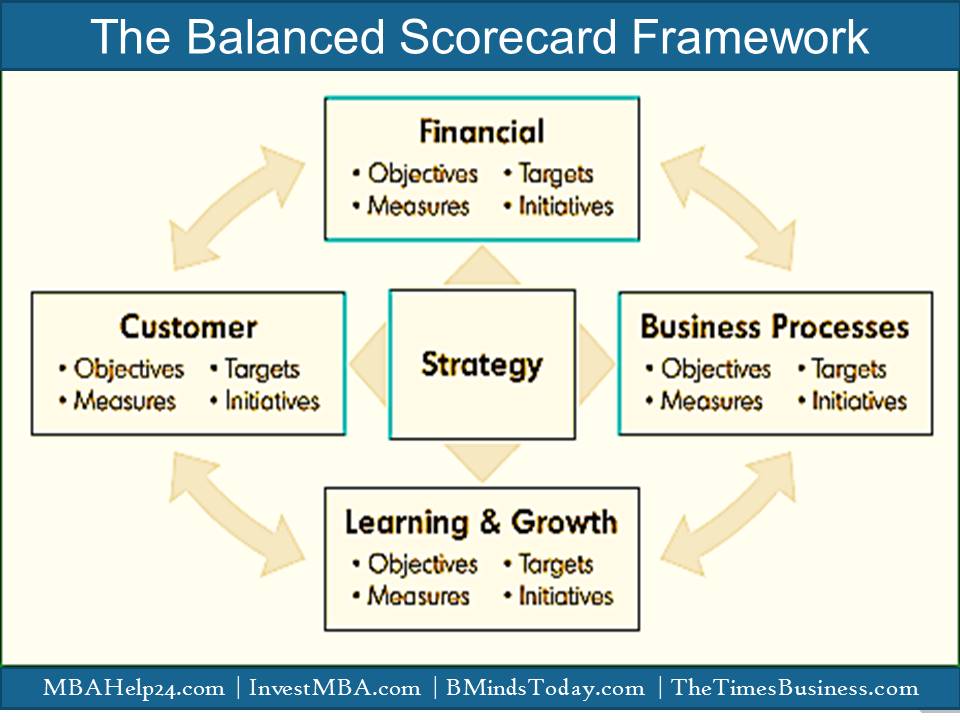
The framework of the Balanced Scorecard can be illustrated in the following diagram;

As far as the perspectives of Balanced Scorecard financial, customer, business processes, and learning and growth are concerned, the following factors need to be defined by the organisation.
- Strategic objectives-what the plan is to attain in that particular perspective.
For example: Cost-effective or profitable growth.
- Measures- In what manner the progress for that specific objective will be measured.
For example: A profitable growth can be measured by growth in net margin.
- Targets- the target value pursued for respective measure.
For example: A target of 4% growth in net margin.
- Initiatives- what will be the action plan to reach the target or objective?
The following sections offer illustrations with appropriate examples of some objectives and measures for the four perspectives.
Financial Perspective
The financial objectives function as the centre for the objectives and measures in all the other scorecard perspectives. Every single measure designated should be part of a link of cause-and-effect relationships that conclude in strengthening financial performance.
The financial perspective signifies the question of how shareholders view the organisation and which financial goals are anticipated from the shareholders’ perspective. The particular financial targets depend on the organisation’s stage in the business life cycle.
For simplification determinations, we classify it in three phases:
Growth stage: Growth businesses are at the initial stages of the business life cycle. Businesses have product or services with substantial growth potential. The organisation goal is growth, such as revenue growth frequency
Sustain stage: Probably the majority of business units in an organisation will be in the sustain stage, where they still attract investment and reinvestment. The key goal at this stage is profitability, such as Return on Equity (ROE), and Return on Capital Employed. Return on capital employed (ROCE).
Harvest stage: This is a mature phase of business life cycle, in which the company wants to harvest the investments made in two earlier stages. The primary goal is to maximise cash flow and the overall financial objectives would be operating cash flow and reductions in working capital requirements.
Strategic Themes for Financial Perspective
It has in many instances been discovered that for each of the three strategies of growth, sustain, and harvest; there are three financial themes that drive the business strategy.
The following table summarizes some illustrations of financial metrics:
| Objective | Measuring strategic financial themes |
| Growth | Sales growth rate, revenue growth and mix |
| Profitability and asset utilisation | Return on equity and investment strategy |
| Cost Leadership | Unit cost reduction and productivity improvement |
Customer Perspective
While developing company’s Strategy Map objectives for the Customer perspective, the value propositions include operational excellence, product Leadership and customer intimacy are recommended to use as a framework for certain deliberations.
Operational excellence: Businesses pursuing an operational excellence disciplines primarily concentrate on competitive price, suitability, and repeatedly “no frills.”
For example, TESCO provides a strong representation of an operationally excellent organisation in retail Industry.
Product leadership: Product leaders often focus on pushing the wrapping of their organization’s products. EMphasising a constant effort on innovation, they make every effort to provide the very finest product in the market.
Adidas is a great example of a product frontrunner in the area of athletic footwear.
Customer intimacy: Undertaking whatever it requires to offer adequate solutions for unique customers’ desires supports define customer-intimate organisations. These sorts of companies normally focus on long-term relationship building with their customers through their profound understanding of customer necessities.
In the retail business, Debenhams characterizes the customer-intimate organization.
The customer perspective basically represents the question of how the organisation is regarded by its customers and how well the organisation is serving its targeted customers in order to reach the financial objectives.
In a nutshell, customers see the organisation in terms of time, quality, performance and cost.
The following table shapes a few examples of particular customer objectives and measures:
| Objective | Measuring customer subjects |
| Brand new or innovative products or services | % of sales from new products |
| Responsive supply | On-time delivery |
| To be favoured supplier | Share of key accounts |
| Customer and market based strategy | Amount of supportive efforts |
Business Process Perspective
In the business process perspective, decision makers recognize the critical business processes in which the organization should excel.
These methods facilitate the business unit in the process of:
- Delivering the value propositions that will entice and retain customers in targeted market segments, and
- Satisfying shareholder anticipations of outstanding financial returns.
In a nutshell, business process perspective represents the question of which processes are most critical for satisfying customers and shareholders.
The illustrations in the following table outline some examples of business process perspective and measures:
| Objective | Measuring Business Process Themes |
| Manufacturing superiority | Cycle time, harvest |
| Increase project production | Production efficiency |
| Decrease product launch interruptions | Concrete take-off date vs. plan |
Learning and Growth Perspective
The fourth perspective of the Balanced Scorecard, learning and growth, classifies the Infrastructure that the organization must build to create long-term growth and improvement. When organisation anticipates attaining ambitious results for business processes, customers, and financial stakeholders; the learning and growth perspective of the Balanced Scorecard serves as the enablers of the three perspectives.
Learning and growth metrics represent the question of how the organisation must learn, improve, and innovate in order to meet its objectives.
Considerable level of this particular perspective is employee-centered.
The illustrations in the following table outline some examples of learning and development measures:
| Objective | Measuring Learning and Growth Themes |
| Engineering learning through technologies and capabilities | Time to new process maturity |
| Product focus | % of products representing maximum share of sales |
| Right period to market | Time compared to that of business rivals |
Connecting multiple scorecard measures to a single strategy
Several organisations may by now be using a combination of financial and non-financial measures. Particularly in modern ages, the transformed effort on customers as well as process quality has caused several organizations to track and communicate measures on customer satisfaction and complaints, product and process deficiency stages, and missed distribution or transport dates.
The Balance Scorecard and Tableau de Bord
In France, businesses have technologically advanced and used, for more than two decades, the Tableau de Bord, a dashboard of key indicators of organizational success. The Tableau de Bord is aimed to help employees “pilot” the organization through recognizing crucial success factors, particularly those that can be measured as physical variables. Does a dashboard of financial and non-financial indicators supply a “Balanced Scorecard?”
Studies say that the finest Balanced Scorecards are more than collections of critical indicators or key success factors.
The multiple measures on a appropriately built Balanced Scorecard must contain of a connected chains of objectives and measures that are equally reliable as well as jointly strengthening.
The metaphor ought to be a flight simulator, not a dashboard of instrument controls. Similar to a flight simulator, the scorecard should incorporate the complex set of cause-and-effect associations among the critical variables, together with leads, delays, and feedback loops, which refer to the trajectory, the flight plan, of the strategy.
The connections should integrate both cause-and-effect relationships, and mixtures of outcome measures together with performance drivers.
Concept & Definition of accounting ?
Characteristics of Accounting ?
Key Differences Between Accounting & Finance ?
basis of accounting: Cash Basis & Accrual Basis ?
Fundamental Financial Accounting Assumptions, Principles & Conventions
Core Steps in Accounting Cycle | During & End of Accounting Period
4 Financial Statements | Balance Sheet | Retained Earnings | Cash Flows
The Balanced Scorecard | Comprehensive Knowledge | Measures | Perspectives
Capital Budgeting | Definitions | Features | Process | FIVE Stages
Capital Budgeting Decisions | Criteria | Substitute Directions | Implications
Liquidity Ratios | Current Ratio | Working Capital Ratio | Quick Ratio
Financial Leverage Ratios | Debt | Total Assets | Equity | Times Interest Earned
Profitability Ratios | Gross Profit Margin | Return On Assets | Return On Equity
Dividend Policy Ratios | Dividend Yield | Payout Ratio | Key Procedural Aspects


